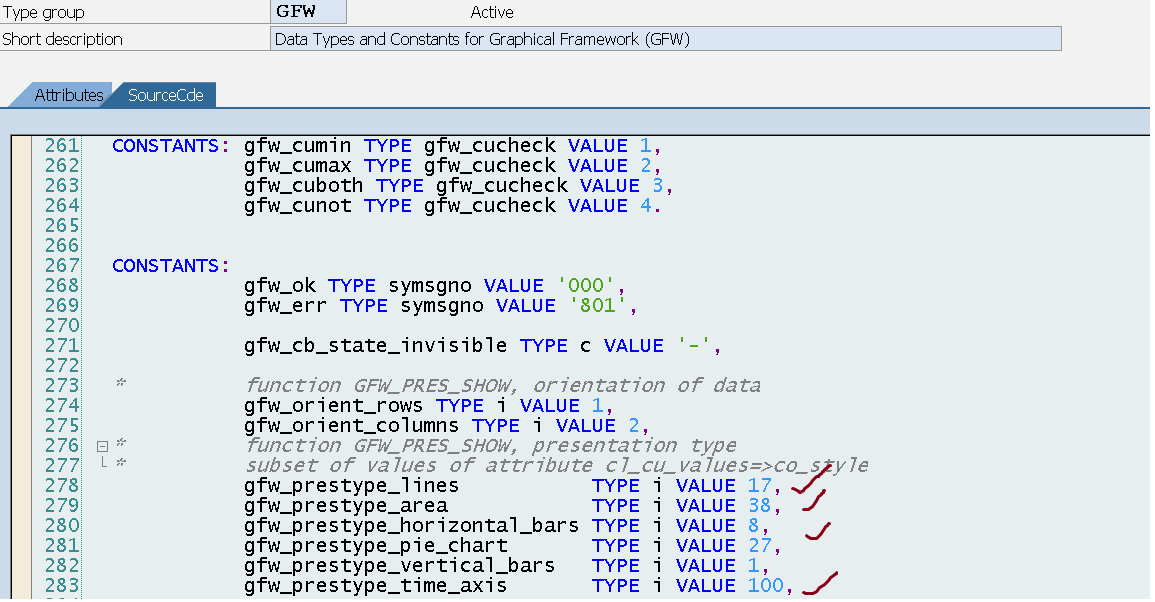
The display of chart on the screen container can be achieved by the standard Function Module : ‘GFW_PRES_SHOW’ . Transaction : GRAL provides all demo programs related to graph framework!a
Step1. Here is the program.
DATA : lt_pt TYPE TABLE OF zflight_chart,
lt_pt_fnl TYPE TABLE OF zflight_chart,
ls_pt TYPE zflight_chart,
lt_val TYPE TABLE OF gprval,
ls_val TYPE gprval,
lt_col TYPE TABLE OF gprtxt,
ls_col TYPE gprtxt,
o_grid TYPE REF TO cl_gui_alv_grid,
o_cust TYPE REF TO cl_gui_custom_container.
PARAMETERS : p_carr TYPE sflight-carrid.
START-OF-SELECTION.
SELECT planetype seatsocc FROM sflight INTO TABLE lt_pt WHERE carrid = p_carr .
IF lt_pt IS NOT INITIAL.
SORT lt_pt BY planetype.
DELETE lt_pt WHERE seatsocc = 0.
LOOP AT lt_pt INTO ls_pt .
COLLECT ls_pt INTO lt_pt_fnl.
ENDLOOP.
LOOP AT lt_pt_fnl INTO ls_pt .
ls_col-coltxt = ls_pt-planetype.
APPEND ls_col TO lt_col.
***************************************
CASE sy-tabix.
WHEN 1.
ls_val-val1 = ls_pt-seatsocc.
WHEN 2.
ls_val-val2 = ls_pt-seatsocc.
WHEN 3.
ls_val-val3 = ls_pt-seatsocc.
WHEN 4.
ls_val-val4 = ls_pt-seatsocc.
WHEN 5.
ls_val-val5 = ls_pt-seatsocc.
WHEN 6.
ls_val-val6 = ls_pt-seatsocc.
WHEN 7.
ls_val-val7 = ls_pt-seatsocc.
WHEN 8.
ls_val-val8 = ls_pt-seatsocc.
WHEN 9.
ls_val-val9 = ls_pt-seatsocc.
WHEN 10.
ls_val-val10 = ls_pt-seatsocc.
ENDCASE.
CLEAR : ls_col, ls_pt.
ENDLOOP.
APPEND ls_val TO lt_val.
CLEAR ls_val.
CALL SCREEN 100.
ELSE.
WRITE ![]() ‘No records are selected, change the selection criteria’.
‘No records are selected, change the selection criteria’.
ENDIF.
*&———————————————————————*
*& Module STATUS_0100 OUTPUT
*&———————————————————————*
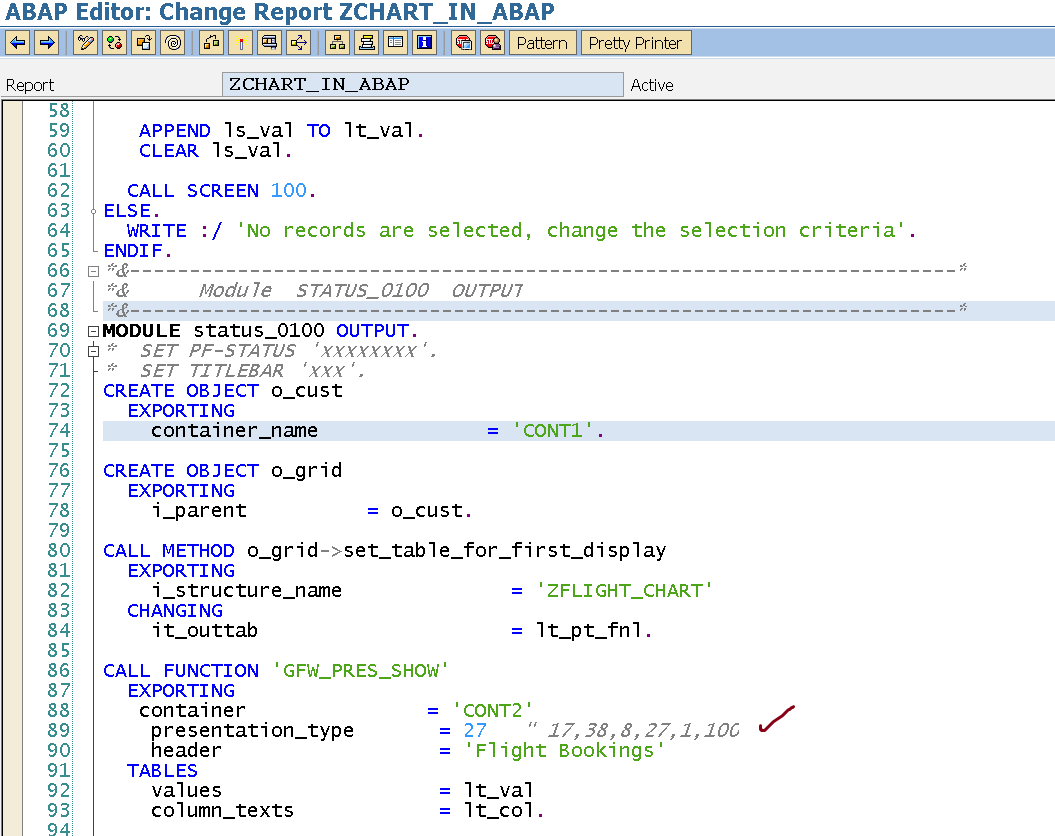
MODULE status_0100 OUTPUT.
* SET PF-STATUS ‘xxxxxxxx’.
* SET TITLEBAR ‘xxx’.
CREATE OBJECT o_cust
EXPORTING
container_name = ‘CONT1’.
CREATE OBJECT o_grid
EXPORTING
i_parent = o_cust.
CALL METHOD o_grid->set_table_for_first_display
EXPORTING
i_structure_name = ‘ZFLIGHT_CHART’
CHANGING
it_outtab = lt_pt_fnl.
CALL FUNCTION ‘GFW_PRES_SHOW’
EXPORTING
container = ‘CONT2’
presentation_type = 27
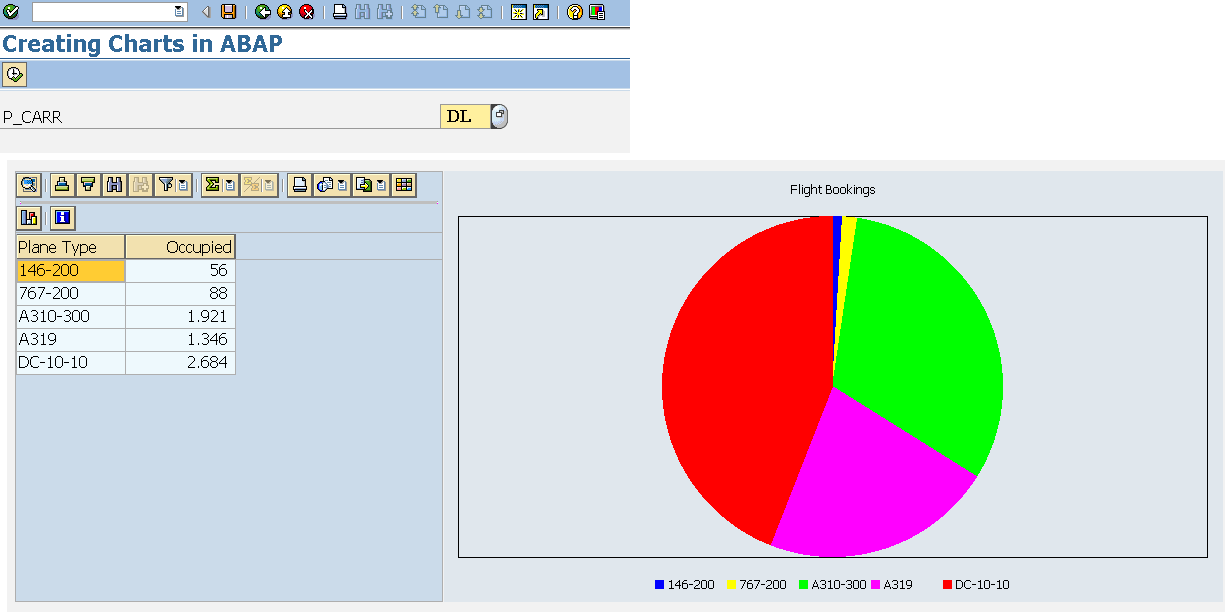
header = ‘Flight Bookings’
TABLES
values = lt_val
column_texts = lt_col.
ENDMODULE. ” STATUS_0100 OUTPUT
Step2. Create a structure for the need.

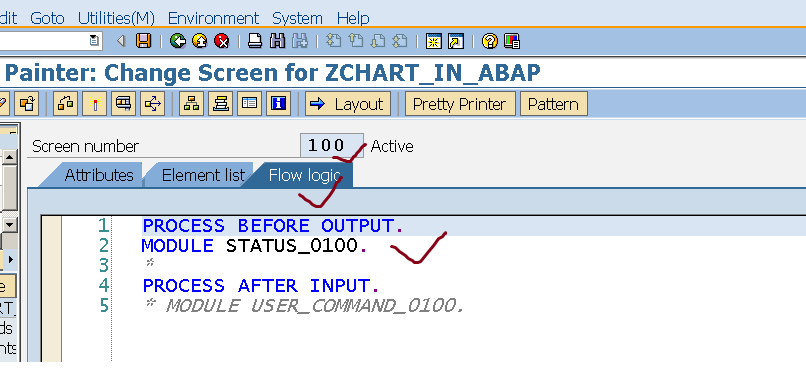
Screen flow logic.
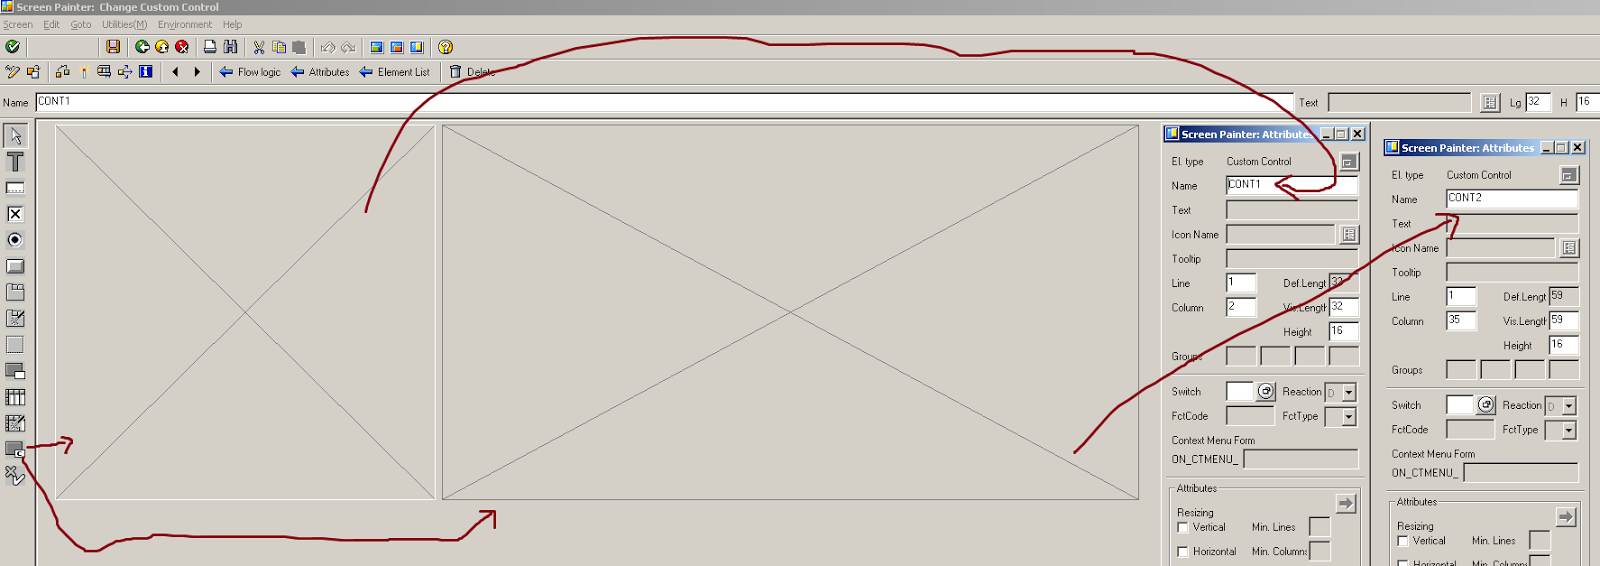
Screen element . Two custom container . One for grid display and one for chart display.
Step3. Execute with an airline id.

Step4. Execute with a different airline id.
Step5. Execute with a different airline id.


in my chart vertical lines is not showing in graph ? i just change the type nothing else .
LikeLike
kindly you change the type and check vertical lines is not showing in your graph. please check and reply .
LikeLike